Sympy for statistics
One of the python module to which I have the most controversial feelings is without any doubt sympy.
Sympy is a great piece of software that can deal with a huge amount of problem in a quite elegant way, and I would really like to use it more in my work. The main drawback was a very poor support for statistic, and making all those integral by hand felt a little odd.
It was with a lot of happiness that I read about the development of a new module for statistics in sympy, called sympy.stats, that promised to address all (or at least most) of the needs that someone can have working out statistical problems.
The foundation for this module has been put into place by Matthew Rocklin in the summer 2012. He made a good job, and the module has been indeed extended to support a great amount of probability distribution, both continuous and finite. There is yet no support for infinite discreet space like the natural numbers, and this means that few very important distribution like the Poisson or the Negative Binomial are still left out, but the overall feeling is very good.
The library is based on the idea of Random variable, defining a probability measure over a certain domain. For example, a normal variable is defined over the whole real axis and implements the gaussian probability density.
A selected amount of operation can be done over these random variables, notably obtaining the density estimation, the probability of an event or the expectation value.
But let the code speak.
Let’s import sympy and sympy.stats, and create a Normal variable with a fixed variance and mean represented by a sympy real variable. Remember that any time we specify a new sympy symbol we have to declare a name for that symbol. in this case our normal distribution will be called simply X.
import sympy
import sympy.stats as stats

mu = sympy.Symbol('mu')
X = stats.Normal('X',mu,1)
We can now ask the expected mean and standard deviation of out random variable:
print sympy.simplify(stats.E(X))
print sympy.simplify(stats.variance(X))
that return, as expected, mu and 1. We can also create new random expression based on the original one. We know for example that a chi squared variable is the sum of N normal, so we can obtain the mean and variance of a 2-degree of freedom Chi distribution simply by summing up the squares of two normal distribution:
X = stats.Normal('X',0,1)
Y = stats.Normal('Y',0,1)
Chi = X**2 + Y**2

stats.E(Chi)
# 2
stats.variance(Chi)
# 4
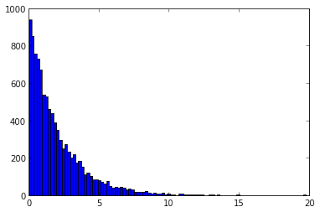
that are exactly the values we were expecting (see Chi Squared distribution) We can sample our expression with sample or sample_iter, and we can look at the resulting distribution:
samples = list(stats.sample_iter(Chi, numsamples=1e4))
we can plot the histogram with pylab as simple as:
pylab.hist(samples, bins=100)
pylab.show()
We can also evaluate the conditioned probability of events, but on continuous function this lead to some heavy integrals, so I will demonstrate it using the more simpler Die class, that represents the launch of a fair n-sided die.
X = stats.Die('X',6)
Y = stats.Die('Y',6)
W = stats.Die('W',6)
Z = X + Y + W
We can ask what is the probability that a realization of X is grater than 4:
stats.P(X>4)
# 1/3
or that it equals a certain value, say 3 (the ugly syntax cannot be avoided due to how the equality test is evaluated):
stats.P(sympy.Eq(X,3))
# 1/6
We can also ask what is the probability that the three dice Z will roll more than 10 given that the first die rolled a 4:
stats.P(Z>10, sympy.Eq(X,4))
So, summing up, the stats module of sympy is really promising and I hope that a lot of work will be done on it to make it even better. If I will understand the sympy development process and the module class hierarchy, I will surely try to make a contribution. Given these praises, for my needs it still lacks several fundamental features:
- support for non-limited discreet spaces
- better support for mixtures of distribution (right now I still get only error complaining about the invertibility of the CDF)
- better fall-back to numerical evaluation, as a lot of distribution are described by integrals and special functions and, even if the integration routine of sympy is pretty solid, not everything can be solved analytically
My best whishes to the sympy team, thank you for your great job!